
Cybercrime is the biggest risk that businesses will face in the future and this is bad news for businesses. We might see cybersecurity attacks continue to grow at an alarming rate and businesses who are not prepared to deal with them will pay a hefty price for it. That is why it is important for businesses to take cybersecurity seriously, keep an eye on cybersecurity trends and make the necessary investments in the right tools and technologies.
If you want a one stop destination where you can find all the cybersecurity statistics in one place, you are at the right place. In this article, you will learn about 200+ fascinating statistics on cybersecurity that will blow you away.
Cybersecurity Statistics
1. 95% of cybersecurity breaches are caused by human error. (Cybint)
2. The worldwide information security market is forecast to reach $170.4 billion in 2022. (Gartner)
3. 75% of organizations worldwide experienced spear phishing attempts in 2020. (Proofpoint)
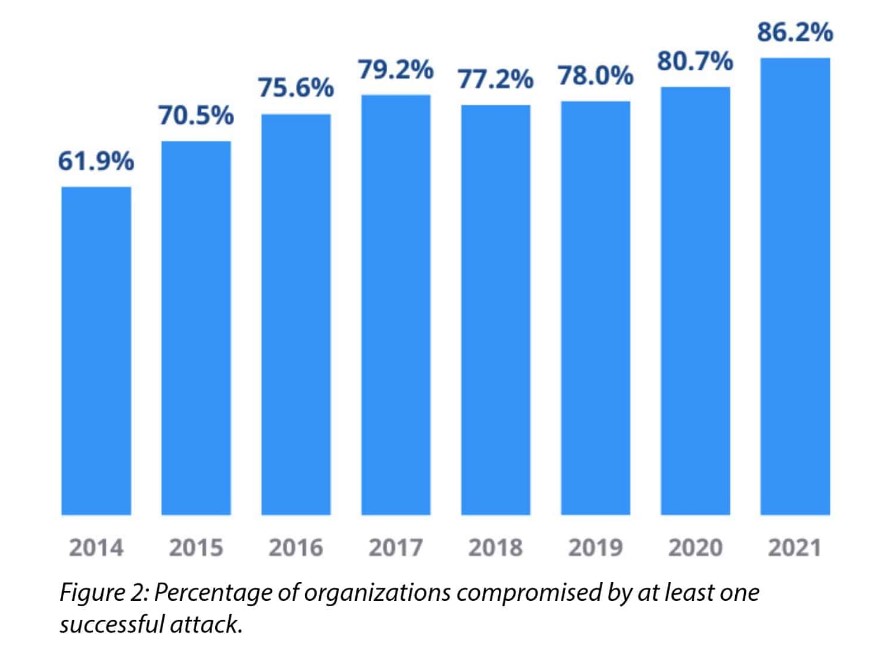
4. 86.2% of surveyed organizations were affected by a successful cyberattack (CyberEdge)
5. 68% of business leaders feel their cybersecurity risks are increasing. (Accenture)
6. On average, only 5% of companies’ folders are properly protected. (Varonis)
7. Data breaches exposed 36 billion records in the first half of 2020. (RiskBased)
8. 86% of breaches were financially motivated and 10% were motivated by espionage. (Verizon)
9. 45% of breaches featured hacking, 17% involved malware and 22% involved phishing. (Verizon)
10. Malicious emails are up 600% due to COVID-19. (ABC News)
11. The top malicious email attachment types are .doc and .dot which make up 37%, the next highest is .exe at 19.5%. (Symantec)
12. An estimated 300 billion passwords are used by humans and machines worldwide. (Cybersecurity Media)
2. Data Breach Statistics
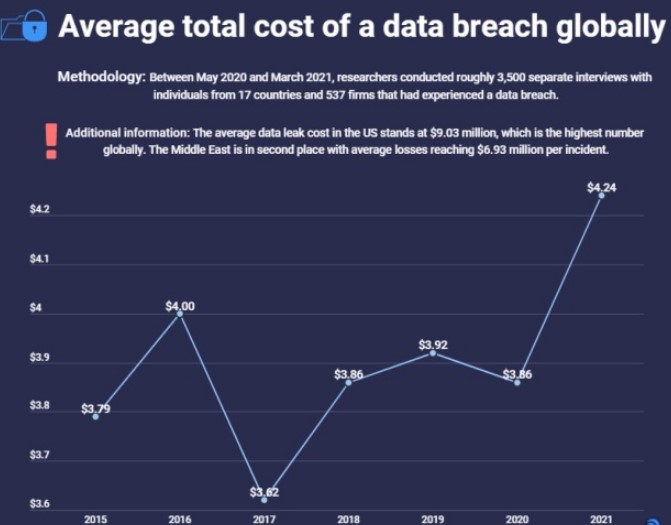
13. The average cost of a data breach is $4.24 million as of 2021. (HOSTNOC)
14. The average time to identify a breach in 2020 was 207 days. (IBM)
15. The average lifecycle of a breach was 280 days from identification to containment. (IBM)
16. 30% of data breaches involve internal actors. (Verizon)
17. Personal data was involved in 58% of breaches in 2020. (Verizon)
18. Security breaches have increased 67% since 2014. (Accenture)
19. 64% of Americans have never checked to see if they were affected by a data breach. (Varonis)
20. 56% of Americans don’t know what steps to take in the event of a data breach. (Varonis)
21. 100,000 groups in at least 150 countries and more than 400,000 machines were infected by the Wannacry virus, at a total cost of around $4 billion. (Technology Inquirer)
22. In one of the biggest breaches of all time, 3 billion Yahoo accounts were hacked in 2013. (New York Times)
3. Ransomware Attack Statistics
23. 37% of respondents’ organizations were affected by ransomware attacks in the last year. (Sophos)
24. In 2021, the largest ransomware payout was made by an insurance company at $40 million, setting a world record. (Business Insider)
25. The average ransom fee requested has increased from $5,000 in 2018 to around $200,000 in 2020. (National Security Institute)
26. Experts estimate that a ransomware attack will occur every 11 seconds in 2021. (Cybercrime Magazine)
27. Out of 1,086 organizations whose data had been encrypted, 96% got their data back. (Sophos)

28. About 1 in 6,000 emails contain suspicious URLs, including ransomware. (Fortinet)
29. The average downtime a company experiences after a ransomware attack is 21 days. (Coveware)
30. 71% of those who are affected by ransomware have been infected. Half of the ransomware attacks that are successful infect at least 20 computers in the organization. (Acronis)
31. The most common tactics hackers use to carry out ransomware attacks are email phishing campaigns, RDP vulnerabilities, and software vulnerabilities. (Cybersecurity & Infrastructure Security Agency)
32. 65% of employers allow their employees to access company applications from unmanaged, personal devices. (Bitglass)
33. According to a survey, 80% of victims who submitted a ransom payment experienced another attack soon after (Cybereason)
34. 46% victims got access to their data but most of it was corrupted. (Cybereason)
35. 60% of survey respondents experienced revenue loss and 53% stated their brands were damaged as a result. (Cybereason)
36. 29% of respondents stated their companies were forced to remove jobs following a ransomware attack. (Cybereason)
37. 42% of companies with cyber insurance policies in place indicated that insurance only covered a small part of damages resulting from a ransomware attack. (Cybereason)
38. The average ransomware payment rose 33% in 2020 over 2019, to $111,605. (Fintech News)
39. The average cost of a ransomware recovery for business is $1.85 million. (Sophos)
40. Ransomware detections have been more dominant in countries with higher numbers of internet-connected populations, and the U.S. ranks highest with 18.2% of all ransomware attacks. (Symantec)
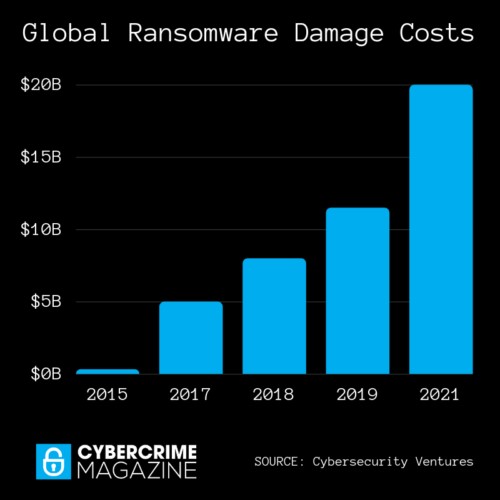
41. The total ransomware costs are projected to exceed $20 billion in 2021. (Cybercrime Magazine)
42. Cybersecurity Ventures predicts that ransomware will cost $6 trillion annually. (Cybersecurity Ventures)
43. In the future, there will be an increase in organizations that will switch to zero-trust security models due to the vulnerability of identity-based threats. (RSA Security)
4. COVID-19 Cybersecurity Statistics
44. Remote workers will be the main target of cybercriminals throughout 2021. (Security Magazine)
b 84% of organizations will keep remote work as the norm even after COVID-19 restrictions are lifted, resulting in an increase of internet users and a greater risk of data exposure. (Bitglass)
46. 27% of COVID-19 cyberattacks target banks or healthcare organizations and COVID-19 is credited for a 238% rise in cyberattacks on banks in 2020. (Fintech News)
47. 52% of legal and compliance leaders are concerned about third-party cyber risks due to remote work since COVID-19. (Gartner)
48. Future hackers will target stay-at-home workers since personal devices are easier to hack than office hardware. (Security Magazine)
49. Most malicious domains, about 60%, are associated with spam campaigns. (Cisco)
50. About 20% of malicious domains are very new and used around one week after they are registered. (Cisco)
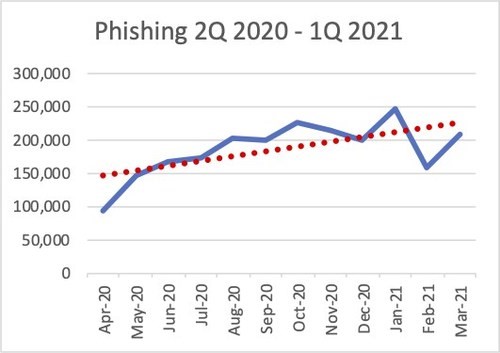
5. Phishing Statistics
51. 48% of malicious email attachments are office files. (Symantec)
52. 3.4 billion phishing emails are sent every day worldwide (Valimail)
53. 54.6% of all email consists of spam. (Alert Logic)
54. 25% of emails from brands consist of phishing emails.(Avanan)
55. 90% of data breaches are caused by phishing.(Verizon)
56. 91% of phishing threats begin with a phishing email. (Deloitte)
57. 96% of phishing attacks have the purpose of gathering intelligence.(Symantec)
58. Phishing increased in 2020 to account for 1 in every 4,200 emails. (Symantec)
59. 65% of groups used spear-phishing as the primary infection vector. (Symantec)
60. 94% of malware is delivered by email. (CSO Online)
61. 1 in 13 web requests lead to malware. (Symantec)
62. Phishing is the second most common threat action involved in data breaches, after denial-of-service following a hack. (Verizon)
63. Phishing attacks account for more than 80% of reported security incidents. (CSO Online)
64. $17,700 is lost every minute due to a phishing attack. (CSO Online)
6. DDoS Attack Statistics
65. 23,000 DDoS attacks take place every day. (NetScout)
66. 16 DDoS attacks occur every minute. (NetScout)
67. 2.9 million DDoS attacks were reported in the first quarter of 2021, which is 31% higher as compared to last year.(InfoSecurity)
68. By 2023, the total number of DDoS attacks worldwide will be 15.4 million. (Cisco)

69. Cybersecurity researchers reported a 53% increase in the number of DDoS attacks targeting healthcare facilities. (AntiDos)
70. Cybersecurity experts noticed a 41% increase in DDoS attacks targeting educational institutions. (AntiDos)
71. More than 90% of DDoS attacks latest for four hours in first quarter of 2021 (Security Magazine)
72. Infrastructure layer attacks accounted for 73% of all DDoS incidents, with 53% relying on a reflection-based attack. Protocol attacks and application-layer attacks accounted for 23% and 16%, respectively (F5 Labs).
73. The Mirai-distributed DDoS worm was the third most common IoT threat. (Symantec)
74. IoT devices experience an average of 5,200 attacks per month. (Symantec)
75. 90% of remote code execution attacks are associated with cryptomining. (Purplesec)
76. 69% of organizations don’t believe the threats they’re seeing can be blocked by their anti-virus software. (Ponemon Institute’s Cost of Data Breach Study)
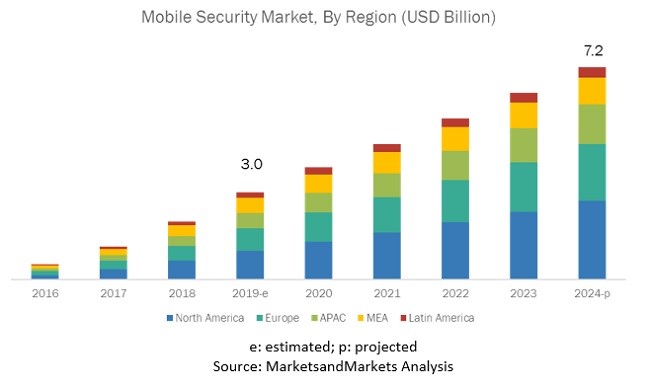
7. Mobile Security Statistics
77. 97% of organizations faced mobile threats that used various attack vectors in 2020.(CheckPoint)
78. 93% of these attacks originated in a device network attempting to trick users into installing a malicious payload via infected websites or URLs, or to steal users’ credentials..(CheckPoint)
79. 46% of organizations had at least one employee download a malicious mobile application. (CISO Mag)
80. 40% of the world’s mobile devices are inherently vulnerable to cyberattacks due to flaws in their chipsets, and need urgent patching.(CheckPoint)
81. An average of 24,000 malicious mobile apps were blocked everyday in 2021. (TechJury)
82. 1 in 36 mobile devices have high- risk apps installed. (Symantec)
83. 60% of decision makers think that mobile based threats are their organization’s biggest threat. (Verizon)
84. 76% of companies said they had been pressured to sacrifice mobile security to “get the job done” in 2021 (Verizon)
8. Cybersecurity Compliance Statistics
85. 66% of companies see compliance mandates driving spending. (CSO Online)
86. Businesses spent $3.1 million on average to meet compliance requirements (IAAP)
87. On average, every employee has access to 11 million files. (Varonis)
88. 15% of companies found 1,000,000+ files open to every employee. (Varonis)
89. 17% of all sensitive files are accessible to all employees. (Varonis)
90. About 60% of companies have over 500 accounts with non-expiring passwords. (Varonis)
91. More than 77% of organizations do not have an incident response plan. (Cybint)
92. Companies reportedly spent $9 billion on preparing for the GDPR, legal advice and teams cost UK FTSE 350 companies about 40% of their GDPR budget or $2.4 million. (Forbes)

93. 88% of companies spent more than $1 million on preparing for the GDPR. (IT Governance)
94. In the GDPR’s first year, there were 144,000 complaints filed with various GDPR enforcement agencies and 89,000 data breaches recorded. (EDPB)
95. 1,000 news sources blocked EU readers to avoid the GDPR compliance rules. (Nieman Lab)
96. The GDPR fines totaled $63 million in its first year. (GDPR.eu)
97. Google was fined $57 billion for GDPR violations by CNIL, a French data protection agency. (TechCrunch)
98. Since the GDPR was enacted, 31% of consumers feel their overall experience with companies has improved. (Marketing Week)
99. 70% of companies agree that the systems they put in place will not scale as new GDPR regulations emerge. (DataGrail)
9. Healthcare Cybersecurity Statistics
100. WannaCry ransomware attack cost the National Health Service (NHS) over $100 million. (Datto)
101. The healthcare industry expected to lose $106.8 million to ransomware attacks in 2021. (Slashdot)
102. The healthcare industry incurs the highest average data breach costs at $7.13 million. (IBM)
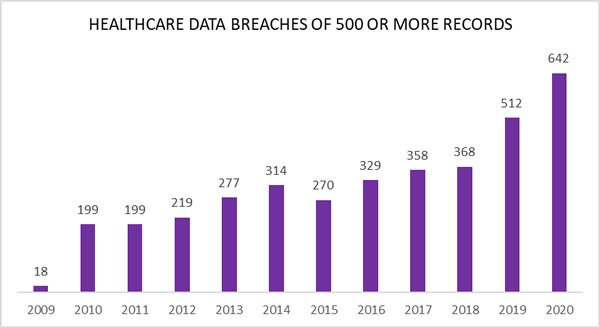
103. More than 93% of healthcare organizations experienced a data breach in the past three years. (Herjavec Group)
104. Financial services have 352,771 exposed sensitive files on average while healthcare, pharma and biotech have 113,491 files on average — the highest when comparing industries. (Varonis)
105. 15% of breaches involved healthcare organizations, 10% in the financial industry and 16% in the public Sector. (Verizon)
10. Finance Cybersecurity Statistics
106. Financial organizations fall victim to cybersecurity attacks 300 times more frequently as compared to other industries. (Forbes)
107. The financial services industry takes in the highest cost from cybercrime at an average of $18.3 million per company surveyed. (Accenture)
108. Nearly two-thirds of financial services companies have over 1,000 sensitive files open to every employee. (Varonis)
109. Financial and manufacturing services have the highest percent of exposed sensitive files at 21%. (Varonis)

110. On average, a financial services employee has access to nearly 11 million files the day they walk in the door. For large organizations, employees have access to 20 million files. (Varonis)
111. The average cost of a financial services data breach is $5.85 million USD. (Varonis)
112. Financial services businesses take an average of 233 days to detect and contain a data breach. (Varonis)
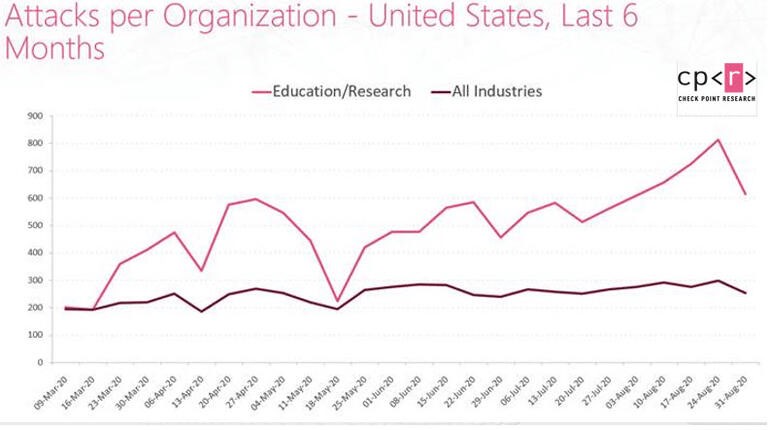
11. Education Cybersecurity Statistics
113. Ransomware attacks against universities increased by 100% between 2019 and 2020. (BlueVoyant)
114. The average cost of a ransomware attack in the higher education industry is $447,000. (BlueVoyant)
115. Since 2020, 1,681 higher education facilities have been affected by 84 ransomware attacks. (Emsisoft)
116. 66% of universities lack basic email security configurations. (BlueVoyant)
117. 38% of analyzed universities in the Cybersecurity in Higher Education Report had unsecured or open database ports. (BlueVoyant)
118. Cyberattacks against K-12 schools rose 18% in 2020. (K-12 Cybersecurity)
12. Government Cybersecurity Statistics
119. The U.S. government incurred the cost of $13.7 billion due to cyberattacks in 2021. (Purplesec)
120. Manufacturing companies account for nearly a quarter of all ransomware attacks, followed by professional services with 17% of attacks, and then government organizations with 13% of attacks. (Security Intelligence)

121. The U.S. government allocated an estimated $18.78 billion for cybersecurity spending in 2021. (Atlas VPN)
13. Cybersecurity Cost Statistics
122. The average cost of a malware attack on a company is $2.6 million. (Accenture)
123. The total cost of cybercrime for each company increased by 12% from $13.0 million in 2018 to 18 million in 2020 (Accenture)
124. Security services accounted for an estimated 50% of cybersecurity budgets in 2020. (Gartner)
125. The average annual security spending per employee increased from $2,337 in 2019 to $2,691 in 2020. (Deloitte)
126. The cost of lost business averaged $1.52 million. (IBM)
127. The average cost in time of a malware attack is 50 days. ( Accenture)
128. The most expensive component of a cyber attack is information loss at $5.9 million. (Accenture)
129. The average cost per lost or stolen record per individual is $146. (IBM)
130. Data breaches cost enterprises an average of $3.92 million. (CSO Online)
131. The cost of data breach for companies with less than 500 employees was $2.35 million.
132. The cost of data breach for companies with less than 1000 employees: $2.53 million
133. The cost of data breach for companies with less than 5000 employees: $3.78 million
134. The cost of data breach for companies with less than 10000 employees: $4.72 million
135. Scandinavia saw the largest increase in total cost of data breaches at 12%, while South Africa saw the largest decrease at 7.4% in 2020. (IBM)
136. The United States experiences the highest data breach costs in the world, at $8.64 million on average, followed by the Middle East at $6.52 million. (IBM)

137. 50% of large enterprises (with over 10,000 employees) are spending $1 million or more annually on security, with 43% spending $250,000 to $999,999, and just 7% spending under $250,000. (Cisco)
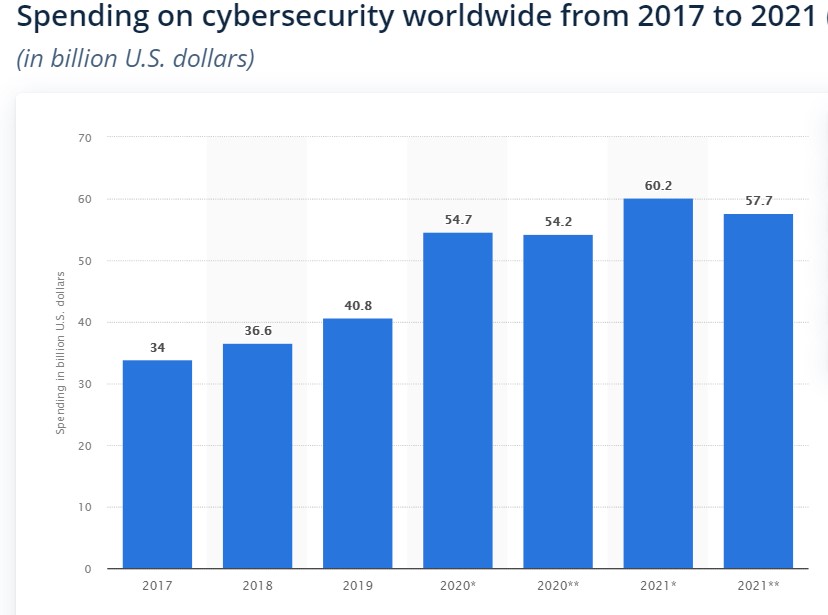
138. In 2021, spending in the cybersecurity industry reached around $60.2 billion USD. (Statista)
139. Worldwide cybercrime costs will hit $6 trillion annually by 2021. (Cybersecurity Ventures)
140. Ransomware damage costs will rise to $20 billion by 2021 and a business will fall victim to a ransomware attack every 11 seconds at that time. (Cybersecurity Ventures)
141. In 2021, the average global cost to remediate a ransomware attack rose to $1.5 million, more than double the previous year’s average ($761,106).(Sophos)
142. Damage related to cybercrime is projected to hit $10.5 trillion annually by 2025. (Cybersecurity Ventures)
143. More than 70 percent of security executives believe that their budgets for fiscal year 2021 will shrink. (Mckinsey)
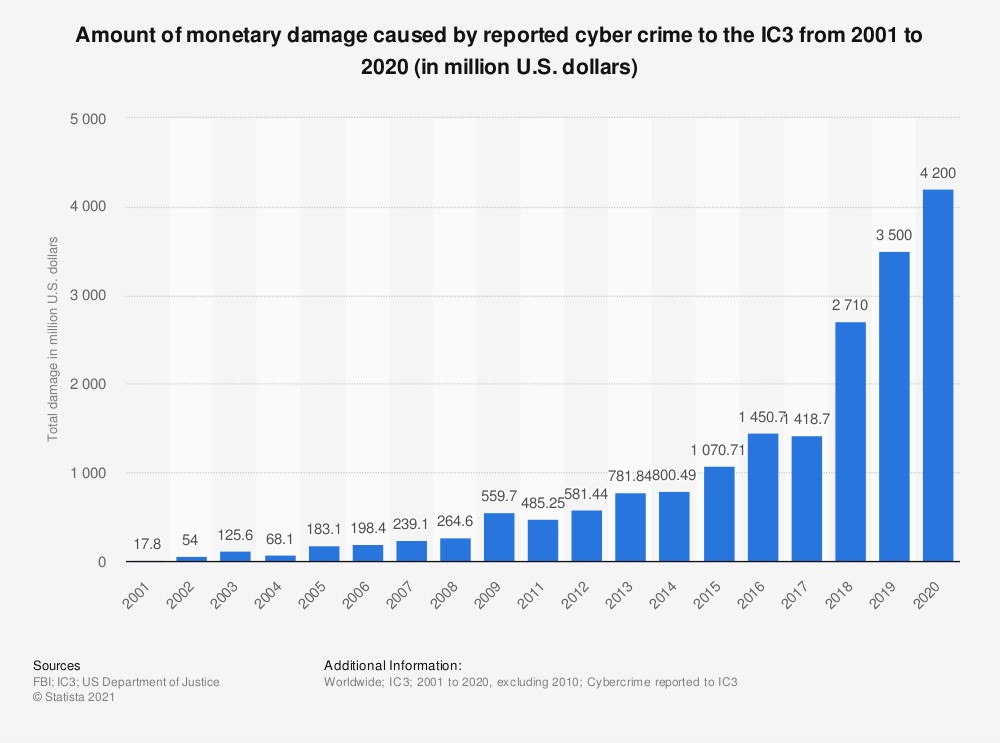
144. Since the pandemic began, the FBI reported a 300% increase in reported cybercrimes. (IMC Grupo)
145. Confirmed data breaches in the healthcare industry increased by 58% in 2020. (Verizon)
146. 33,000 unemployment applicants were exposed to a data security breach from the Pandemic Unemployment Assistance program in May. (NBC)
147. Americans lost more than $97.39 million to COVID-19 and stimulus check scams. (Atlas VPN)
148. In April 2020, Google blocked 18 million daily malware and phishing emails related to Coronavirus. (Google)
149. Remote work has increased the average cost of a data breach by $137,000. (IBM)
52. 47% of employees cited distraction as the reason for falling for a phishing scam while working from home. (Tessian)
153. 81% of cybersecurity professionals have reported their job function changed during the pandemic. (ISC)
154. Half a million Zoom user accounts were compromised and sold on a dark web forum in April 2020. (CPO Magazine)
155. Remote workers have caused a security breach in 20% of organizations. (Malwarebytes)
14. Cybersecurity Jobs Statistics
156. 61% of companies think their cybersecurity applicants aren’t qualified. (ISSA)
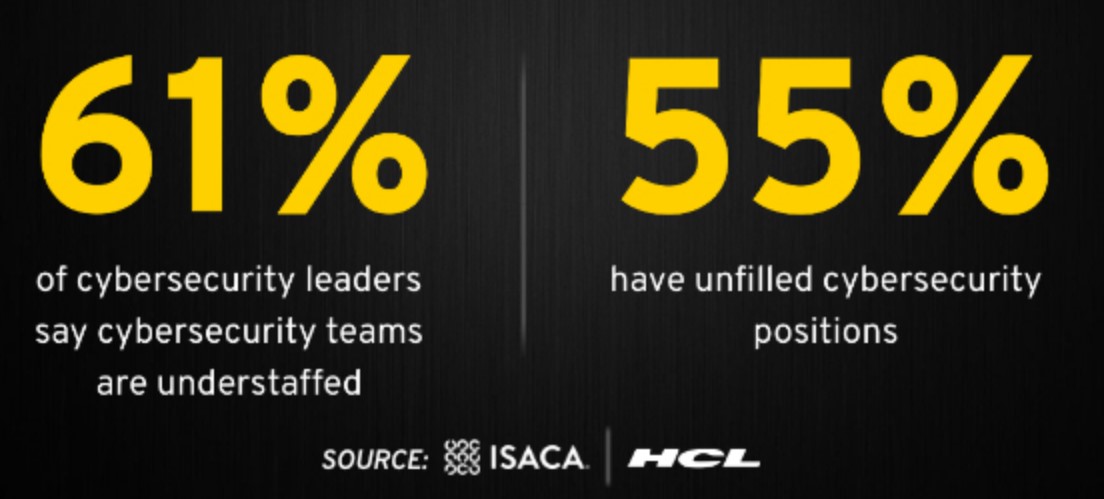
157. 70% of cybersecurity professionals claim their organization is impacted by the cybersecurity skills shortage. (ESG & ISSA)
158. Since 2016, the demand for Data Protection Officers (DPOs) has skyrocketed and risen over 700%, due to the GDPR demands. (Reuters)
159. 500,000 Data Protection Officers are employed (IAAP)
160. More than two-thirds of cybersecurity professionals struggle to define their career paths. (ISSA)
161. 61% of cybersecurity professionals aren’t satisfied with their current job. (ISSA)
162. There was a 350 percent growth in open cybersecurity positions from 2013 to 2021.( Cybercrime Magazine)
163. 40 percent of IT leaders say cybersecurity jobs are the most difficult to fill. (CSO Online)
164. Cyber security engineers are some of the highest-paid positions started at $140K annually on average. (Cybint)
165. The cybersecurity unemployment rate is 0% and is projected to remain there through 2021. (CSO Online)
166. By 2021, 100% of large companies globally will have a CISO position. (Cybersecurity Ventures)
167. By 2021, there will be 4 million unfilled cybersecurity jobs globally. (Netsparker)
168. Information Security Analysts job positions in the US are expected to grow 31% from 2019–29. (Bureau of Labor Statistics)
169. Computer Network Architect job positions in the US are expected to grow 5% from 2019–29. (Bureau of Labor Statistics)
170. Computer Programmer job positions in the US are expected to decline 9% from 2019–29. (Bureau of Labor Statistics)
15. Small Business Cybersecurity Statistics
171. 43% of small businesses have no cybersecurity defense plan in place. (Bull Guard)
172. 60% of small business owners do not think their business is a target for cybercriminals.(Bull Guard)
173. 74% of small business attacks were executed by external actors, as opposed to internal employees, as reported in the Verizon 2020 report. (Verizon)

174. 84% of small business attacks focused on monetary gain with 8% focused on espionage and the remainder focused on hacking for fun or grudges, again reported by Verizon.
175. 22% of small businesses transitioned to remote work without a cybersecurity plan in place. (Alliant)
176. Smaller organizations (1–250 employees) have the highest targeted malicious email rate at 1 in 323. (Symantec)
16. Cloud Security Statistics
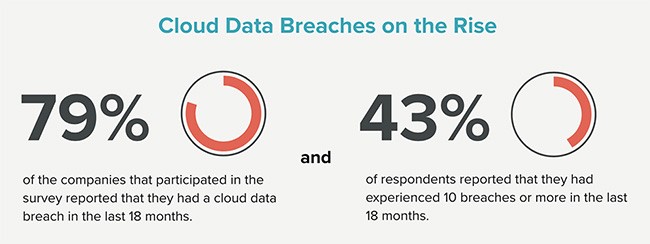
177. 79% of organizations have experienced at least one cloud data breach (Ermetic)
178. 43% has reported ten or more cloud based data breaches in past two years.(Ermetic)
179. 83% of organizations say they need to improve their cloud security (Channel Futures)
180. More than 70% of organizations will be using Security-as-a-Service by 2021 (Gartner)
181. Just 21% of organizations use Cloud Access Security Brokers (CASB) (Channel Futures)
182. Cloud-based cyber attacks rose 630% between January and April 2020. (Fintech News)
183. 48% of respondents cited that their biggest barrier to cloud adoption was security and 37% stated the need to remain compliant was the most prevalent blocker (Data Center News)
184. 76% of security professionals admit securing their cloud environments is a struggle (Security Boulevard)
185. 45% of companies globally have experienced security attacks fuelled by visibility and control deficiencies relating to the management and access of IaaS (SailPoint)
186. 65% consider cloud security the most important skill for migrating or implementing cloud infrastructure (Channel Partners Online)
187. 79% of enterprises want better-integrated security and governance for their data in the cloud (Help Net Security)
188. 92% believe their organization has a cloud security readiness gap (CBR Online)
17. Insider Threat Statistics
189. 60% of data breaches are caused by insider threats (Security Intelligence).
190. 68% of organizations have observed that insider attacks have become more frequent over the last 12 months (Cybersecurity Insiders)
191. The number of insider-caused cybersecurity incidents increased by 47% in the last three years (ObserveIT).
192. Another report predicts that the frequency of insider data breaches will increase by 8% through 2021 (Forrester).
193. 61% of companies have had an insider attack in the past year (Bitglass).
194. 60% of organizations had more than 20 incidents of insider attacks a year (IBM).

195. 63% of organizations think that privileged IT users pose the biggest insider security risk to organizations (Cybersecurity Insiders)
196. 60% of companies said managers with access to sensitive information are the top insider threat actors. This is followed by contractors and consultants (57%), and regular employees (51%) (Bitglass)
197. 78% don’t believe that they have very effective processes in place when managing IT privileges (Cybersecurity Insiders)
198. 78% businesses lack confidence in their cybersecurity posture (Forbes)
199. Fraud (55%), monetary gain (49%), and IP theft (44%) are the top motivations for insider attacks (Fortinet).
200. 62% of insider incidents are caused by negligent employees or contractors, making it one of the most common insider threats. The least common type is malicious insiders (14%) (Panda Security).
201. 38% of cybersecurity experts perceive phishing as the biggest vulnerability among accidental insider threats (Fortinet).
202. In the US, the most common type of insider threat is data exfiltration (62%). This is followed by privilege misuse (19%), data aggregation/snooping (9.5%), infrastructure sabotage (5.1%), circumvention of IT controls (3.8%), and account sharing (0.6%) (Securonix).
203. The average annual cost of insider threats has skyrocketed in only two years, rising 31% to $11.45 million (ObserveIT).

204. 86% of organizations say they find it moderately difficult to determine the actual damage of an insider attack (Cybersecurity Insiders).
205. It’s difficult to compute the true cost of a major security breach, but 50% of organizations say their estimate is less than $100,000. Thirty-four percent said they expect damages to be between $100,000 and $500,000 (Cybersecurity Insiders).
206. Companies in North America experienced the highest average annual cost of insider threats at $13.3 million. Followed by the Middle East at $11.65 million. Europe’s cost amounted to $9.82 million, while Asia-Pacific totaled $7.89 million (IBM).
207. Negligent insiders cost companies around $307,000 per incident. Criminal insiders cost $756,000 per incident, while credential thieves cost $871,000 per incident (ObserveIT).
208. The industry and size of the company make a difference on the amount spent on combating insider threats. Large organizations (more than 75,000 employees) spent an average of $17.92 million over the past year. In contrast, smaller organizations (below 500 employees) spent an average of $7.68 million (ObserveIT).
209. Meanwhile, the sector that spent the most on measures against insider threats is the financial services sector ($14.50 million). The services sector and the technology and software sector follow with $12.31 million and $12.30 million, respectively (IBM).
210. 68% of businesses feel extremely moderately vulnerable to insider attacks (Cybersecurity Insiders).

211. Only 42% have the appropriate controls in place to prevent an insider attack (AT&T Business).
212. In response to these threats, 43% of organizations expect a budget increase for IT security over the next year (AT&T Business).
213. 52% of businesses agree that it’s harder to detect insider threats than external attacks (Cybersecurity Insiders).
214. The BYOD system in companies has amplified insider threats with 82% of organizations not able to detect insider threats from personal devices used by their employees (Bitglass).
215. 53% of companies said the transition to cloud computing has made it harder to detect insider attacks (Cybersecurity Insiders).
216. When it comes to countering insider threats, 61% of organizations are focusing on deterrence . This is followed by detection of internal threats (60%), and analysis and post-breach forensics (45%) (Cybersecurity Insiders).
217. Majority of companies are deploying user training awareness (55%) to prevent insider attacks. This is followed by data loss prevention (54%), and user behavior analytics (50%) (IBM).
218. User behavior analytics (UBA) ($3.4 million), privileged access management ($3.1 million), and user training and awareness ($3 million) were the top tools and strategies that gave the highest cost savings for companies (IBM).
18.
Business Email Compromise Statistics
219. Business email compromise rose by 14% overall in 2020 and up to 80% in some sectors (ID Agent)
220. 65% of organizations faced BEC attacks in 2020 (ProofPoint)
221. In 2020, BEC costs increased rapidly, from $54,000 in Q1 2020 to $80,183 in Q2 (Digital Guardian)
222. The energy and infrastructure sector topped the 2020 list with 93% of attacks (ID Agent)
Which is the most amazing cybersecurity statistics you have ever read? Share it with us in the comments section below.


Add comment